The Classes tab helps Studios understand how your schedule is performing so you can make informed decisions that drive growth. It brings together clear insights, trends, and action steps—no spreadsheets required.
Why it matters:
The Classes tab turns raw attendance and rating data into clear insights and actionable steps, helping you optimize your schedule, improve class performance, and increase revenue with confidence.
Classes Tab:
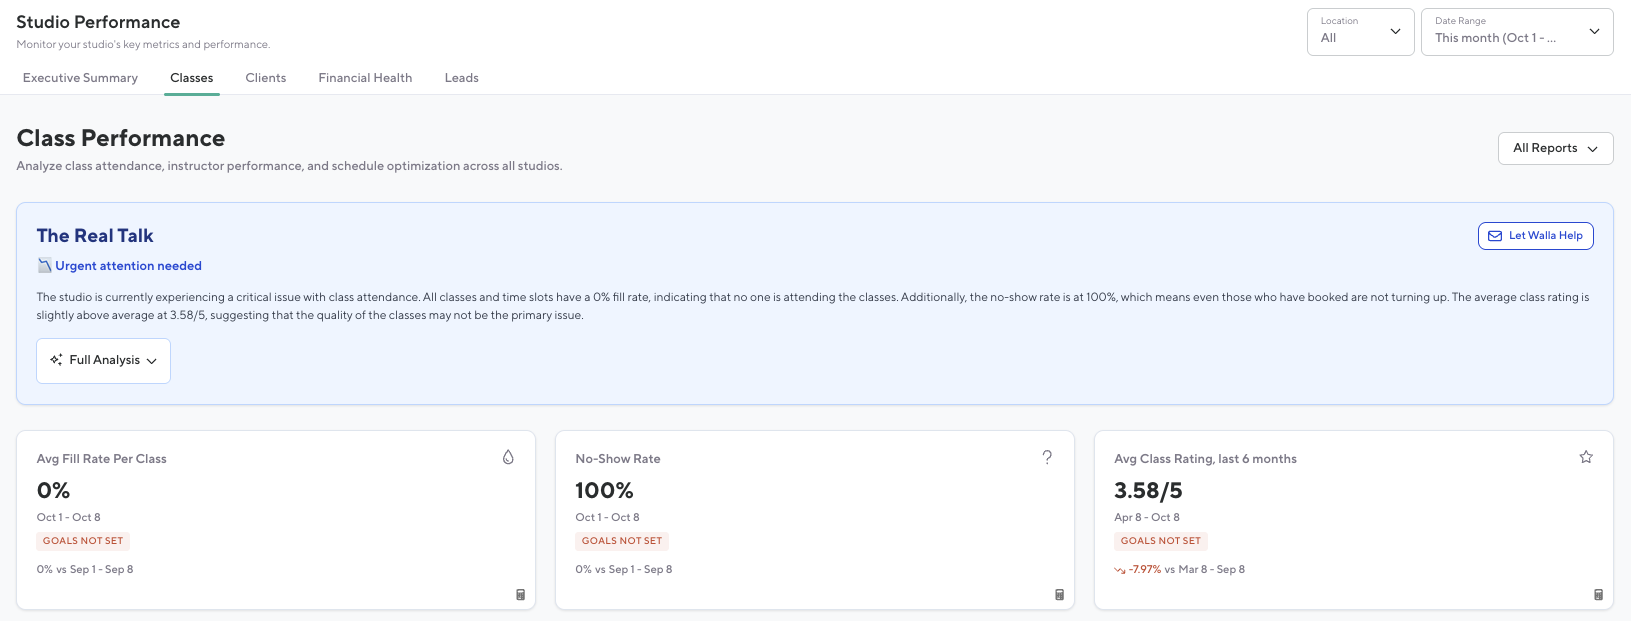
Real Talk Analysis:
-
Contextual analysis of class performance with plain-language explanations of what the numbers mean for the business
-
Display Overall performance score with contextual interpretation
-
Based on AI prompt (will not be included in this pitch because it can change)
-
-
Action Items: Prioritized list of actionable steps to improve financial health, including specific targets and timelines
Top Card Stats:
-
Avg. Fill Rate for Class:
-
The number of spots booked per class vs capacity averaged over all classes in the date range. Fill rate shows how full the average class was. Each class counts the same, no matter the size, so you can quickly see what a typical class looked like for your studio Includes both in-person and livestream.
-
Includes both in-person and livestream classes.
-
Displays this month vs. last month comparison.
-
Integrates with Goals section to surface progress:
-
Green = goal met or exceeded
-
Red = below goal
-
-
-
-
No-Show Rate
-
Percentage of no-shows for all classes.
-
Displays this month vs. last month comparison.
-
Integrates with Goals section:
-
Green = within or below target
-
Red = above target
-
-
-
-
Avg Class Rating, last 6 months
-
The average rating for all classes held in the date range. Ratings included all ratings for those classes over the last 6 months.
-
Includes all class ratings submitted during that period.
-
Integrates with Goals section:
-
Green = goal met or exceeded
-
Red = below goal
-
-
-
Graphs:
-
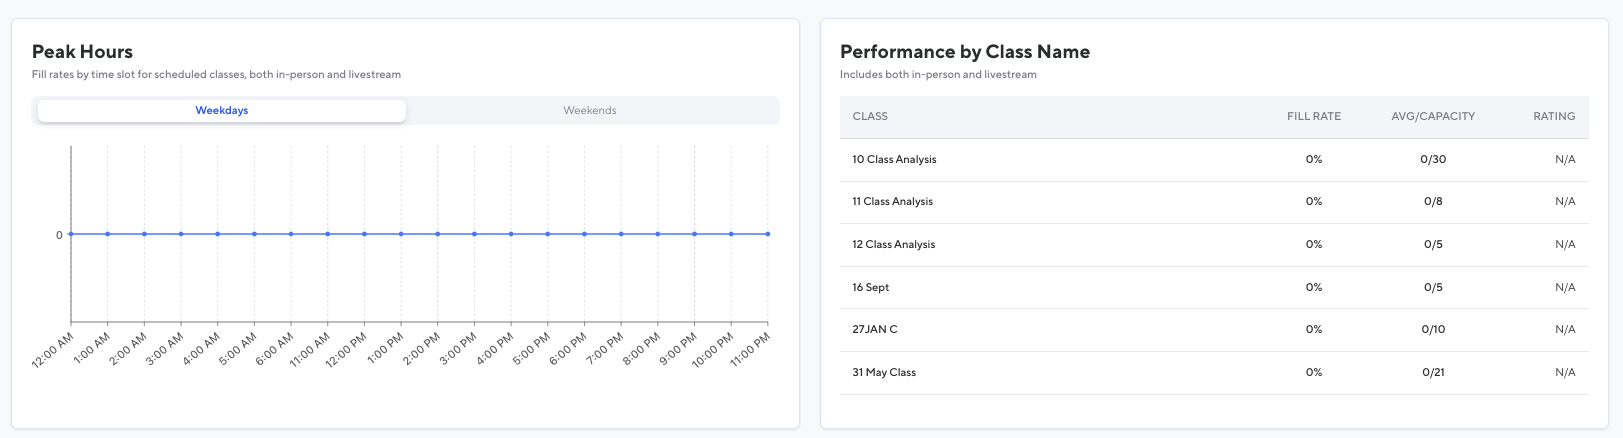
Peak Hours
-
Visualizes average fill rates by time slot for scheduled classes (in-person and livestream).
-
Displays separate data for:
-
Weekdays
-
Weekends
-
-
Hover Details:
-
Average fill rate for each class time
-
-
-
-
Performance by Class Name Table
-
Summarizes performance of each class type (includes in-person and livestream).
-
Columns:
-
Class Name
-
Fill Rate
-
Avg/Capacity
-
Rating
-
-
-