Giving studios the ability to track member acquisition, retention, and engagement across all locations.
Client Metrics Tab: (Going Live for Beta)
Giving studios the ability to track member acquisition, retention, and engagement across all locations.
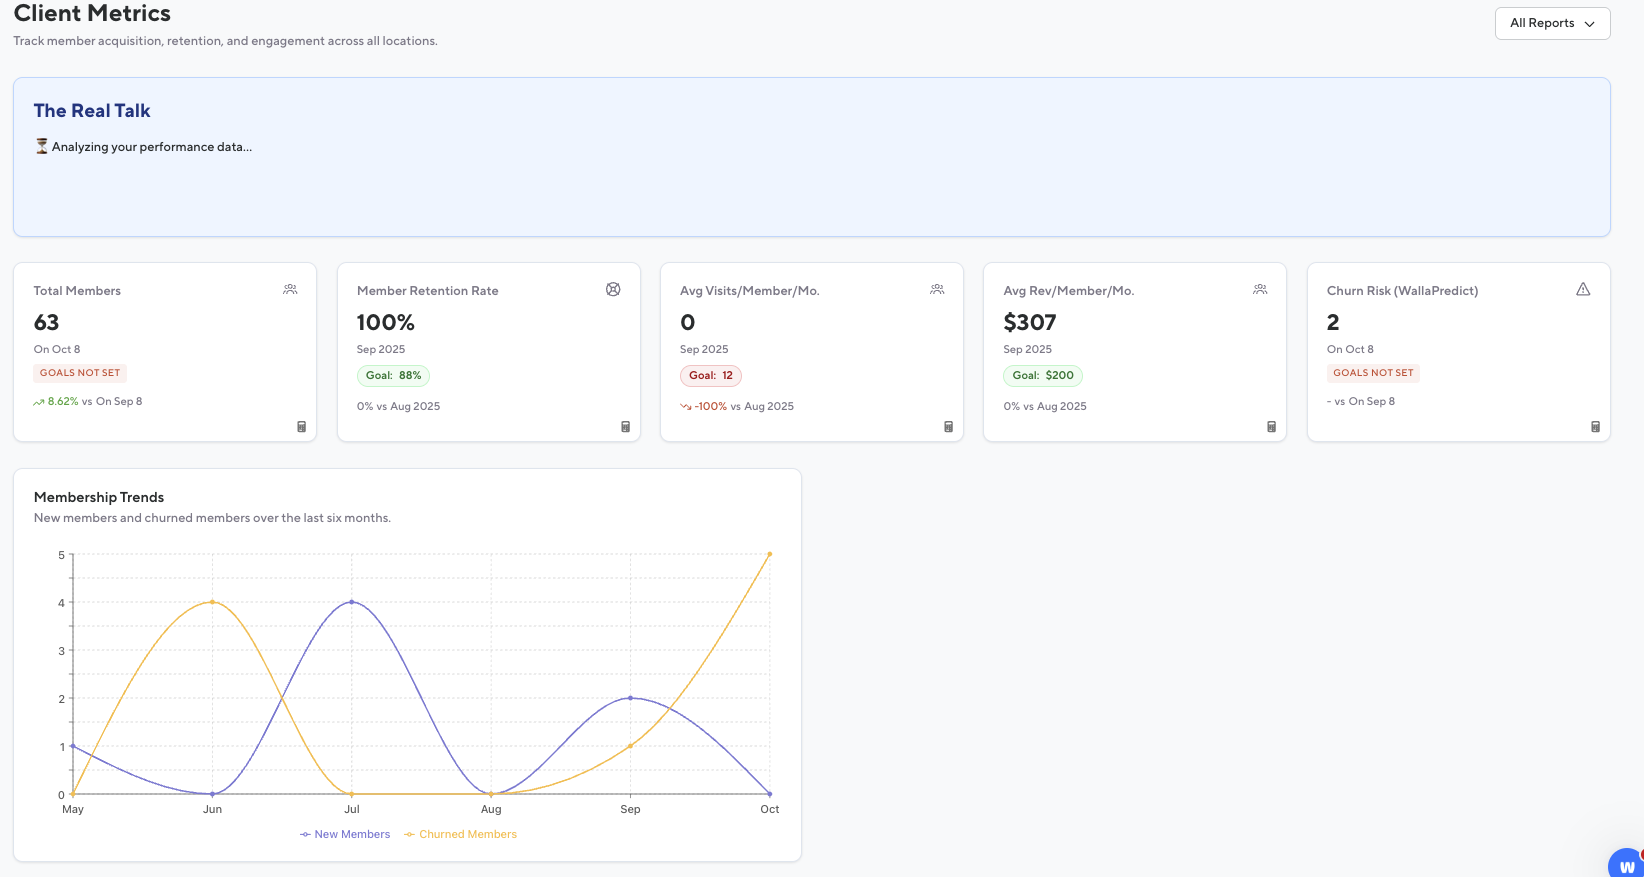
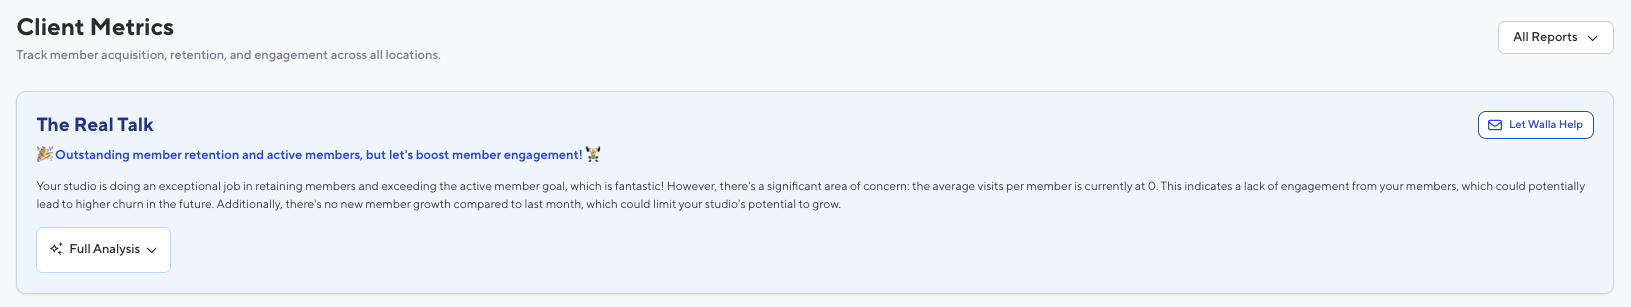
Real Talk
-
Contextual analysis of class performance with plain-language explanations of what the numbers mean for the business
-
Display Overall performance score with contextual interpretation
-
Based on AI prompt (will not be included in this pitch because it can change)
-
-
Action Items: Prioritized list of actionable steps to improve financial health, including specific targets and timelines
Metrics Cards:
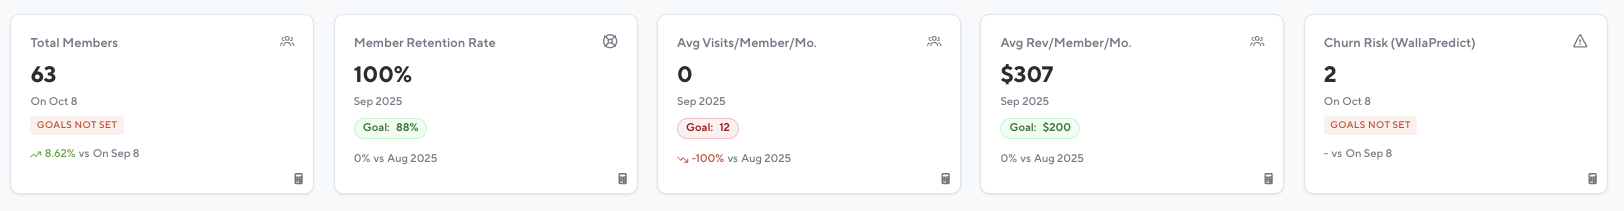
Total Members
-
The total number of active members today vs same day last month.
-
If viewing past months the count will be from the last day of that month.
-
-
Shared plans count as many users that are on that plan if it grants member status
-
This month compared to last month
-
Integrates with Goals section:
-
Green = goal met or exceeded
-
Red = below goal
-
Member Retention Rate
-
Percentage of clients who had plans in September and still have an active plan in September.
-
This month compared to last month
-
-
Integrates with Goals section:
-
Green = goal met or exceeded
-
Red = below goal
-
Avg. Visits/Member/Mo
-
Number of visits for all clients with an active plan divided by the number of clients with an active plan.
-
A full month of data is required.
-
-
This month compared to last month
-
Integrates with Goals section:
-
Green = goal met or exceeded
-
Red = below goal
-
Avg. Revenue/Member/Mo
For all active members, the total amount of money spent in the date range.
-
This month compared to last month
-
Integrates with Goals section:
-
Green = goal met or exceeded
-
Red = below goal
-
Churn Risk (WallaPredict)
-
Number of clients currently identified by WallaPredict as a churn risk. If viewing past months the count will be from the last day of that month.
-
This month compared to last month
-
Integrates with Goals section:
-
Green = goal met or exceeded
-
Red = below goal
-
Graph:
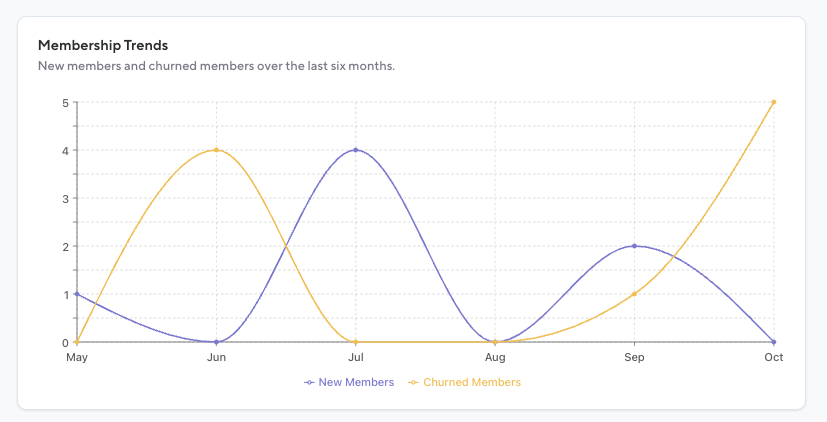
Membership Trends
-
New members and churned members over the last six months.
-
When hovering over a month you will see “New Members vs Churned Members”