Skip to content
English
  • There are no suggestions because the search field is empty.

Executive Summary | Walla Support Center

[email protected]

Executive Summary

The Executive Summary provides a high-level, AI-generated overview of your business performance based on five key metrics. It’s designed to quickly answer “How are we doing?” by summarizing recent performance, highlighting trends, and suggesting action.

Why it Matters:

  • Gives owners and managers a clear snapshot of business health without manual reporting.

  • Surfaces actionable insights to help you stay on track with goals.

  • Enables faster, data-driven decisions by highlighting what changed this week or month.

Gives owners and managers a clear snapshot of business health without manual reporting.

Surfaces actionable insights to help you stay on track with goals.

Enables faster, data-driven decisions by highlighting what changed this week or month.

Functionality:


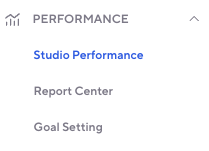
Studios can access this through the left side navigation here:

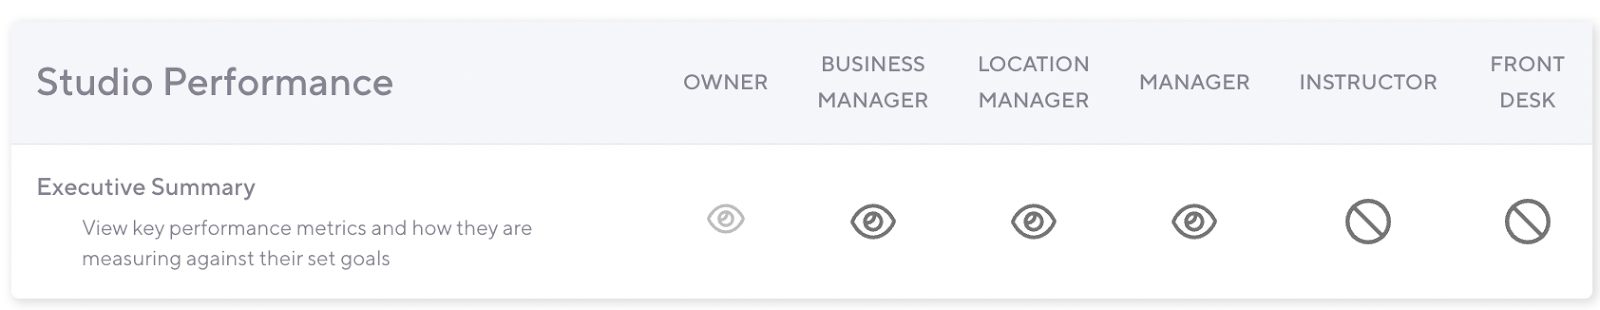
New customizable permission here:


“Let Walla Help” emails support for more strategic guidance on how to action

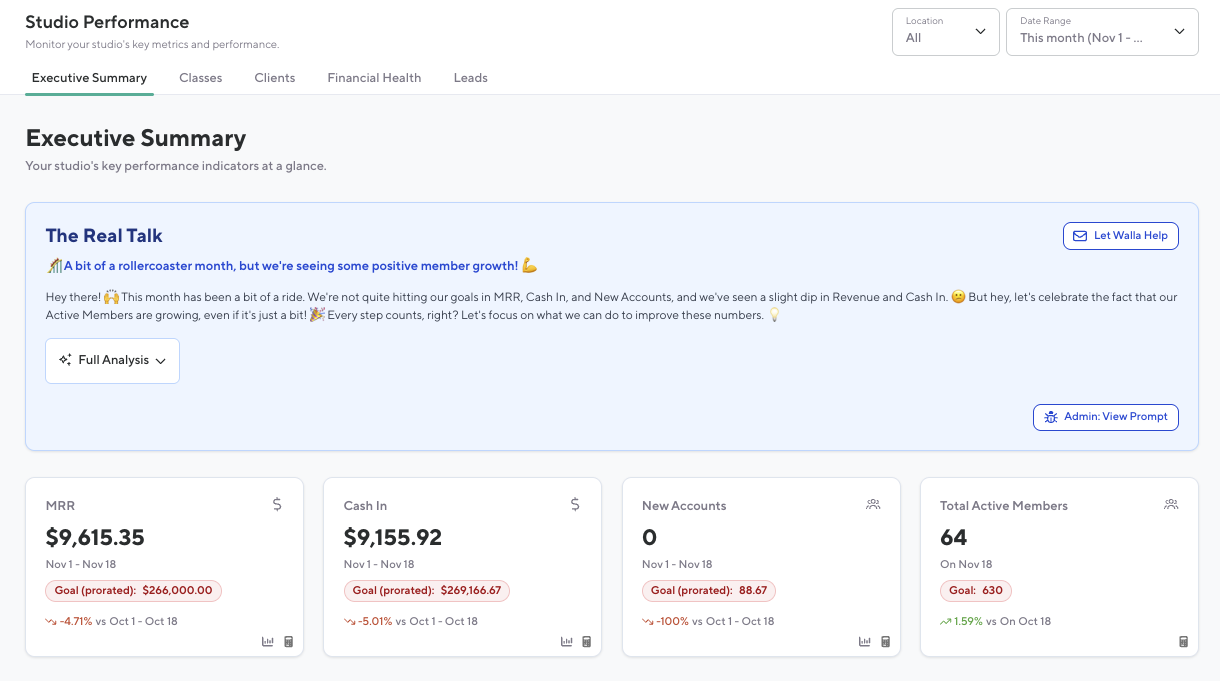
The Executive Summary Dashboard summaries what has happened at a studio within the current month and provides actionable items to increase the studio’s goals.

  • Each Report tile links out to the corresponding report (if applicable) and provides a calculation

Each Report tile links out to the corresponding report (if applicable) and provides a calculation

  • Metrics Tracked (compared to the same date range in the previous month):

    • Monthly Recurring Revenue (MRR) - Links directly to the MRR report for deeper insights.

      • Compares the same date range to the previous month. For example, viewing data on the 7th will compare the 1–7th of the current month to the 1–7th of the previous month.

    • Cash In - Links out to the Sales report

      • All money collected from clients this period (credit card, cash, gift card sales, account balance top-ups/payments). Includes tax collected and does not account for any cash refunded.

    • New Accounts - Surfaces popup with additional information on the total number of new accounts

Metrics Tracked (compared to the same date range in the previous month):

  • Monthly Recurring Revenue (MRR) - Links directly to the MRR report for deeper insights.

    • Compares the same date range to the previous month. For example, viewing data on the 7th will compare the 1–7th of the current month to the 1–7th of the previous month.

  • Monthly Recurring Revenue (MRR) - Links directly to the MRR report for deeper insights.

    • Compares the same date range to the previous month. For example, viewing data on the 7th will compare the 1–7th of the current month to the 1–7th of the previous month.

    • Compares the same date range to the previous month. For example, viewing data on the 7th will compare the 1–7th of the current month to the 1–7th of the previous month.

    • Cash In - Links out to the Sales report

      • All money collected from clients this period (credit card, cash, gift card sales, account balance top-ups/payments). Includes tax collected and does not account for any cash refunded.

    • Cash In - Links out to the Sales report

      • All money collected from clients this period (credit card, cash, gift card sales, account balance top-ups/payments). Includes tax collected and does not account for any cash refunded.

      • All money collected from clients this period (credit card, cash, gift card sales, account balance top-ups/payments). Includes tax collected and does not account for any cash refunded.

      • New Accounts - Surfaces popup with additional information on the total number of new accounts

      • New Accounts - Surfaces popup with additional information on the total number of new accounts

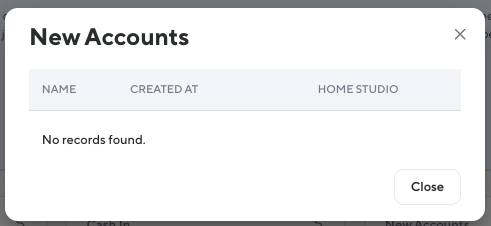
        The number of new client records added in the period.

        • Total Active Members - The number of active memberships today vs same day last month.

        Total Active Members - The number of active memberships today vs same day last month.

        • Visual Indicators

          • Shows performance with red (below target), yellow (moderate), or green (on track). If no goal is set, a neutral color is shown.

        Visual Indicators

        • Shows performance with red (below target), yellow (moderate), or green (on track). If no goal is set, a neutral color is shown.

        • Shows performance with red (below target), yellow (moderate), or green (on track). If no goal is set, a neutral color is shown.